The St Vincent de Paul Society – known to many as Vinnies – assists people experiencing poverty and inequality and works to shape a more just and compassionate society.
Bushfires put vulnerable communities at risk
When Australia’s east coast was devastated by bushfires in the summer of 2019-20, Vinnies wanted to reach vulnerable communities, including people with disability and people experiencing poverty. Identifying the thousands in need required rapid and easily understandable data.
Nous supported Vinnies to undertake this data analysis with pro-bono consulting services as part of our Community Partnership Scheme.
Nous combined data sources to gain rapid insights
Nous analysed data to understand how Vinnies could best reach vulnerable communities. We:
- examined New South Wales Office of Emergency Management data that showed the number of properties damaged or destroyed by bushfires in each location
- used natural language processing to link this data with data from the Australian Bureau of Statistics to add information on population, median household income, internet access, Indigenous and Torres Strait Islander status, disability status, household ownership/renting and education level
- developed a spreadsheet with demographic data alongside fire impact information
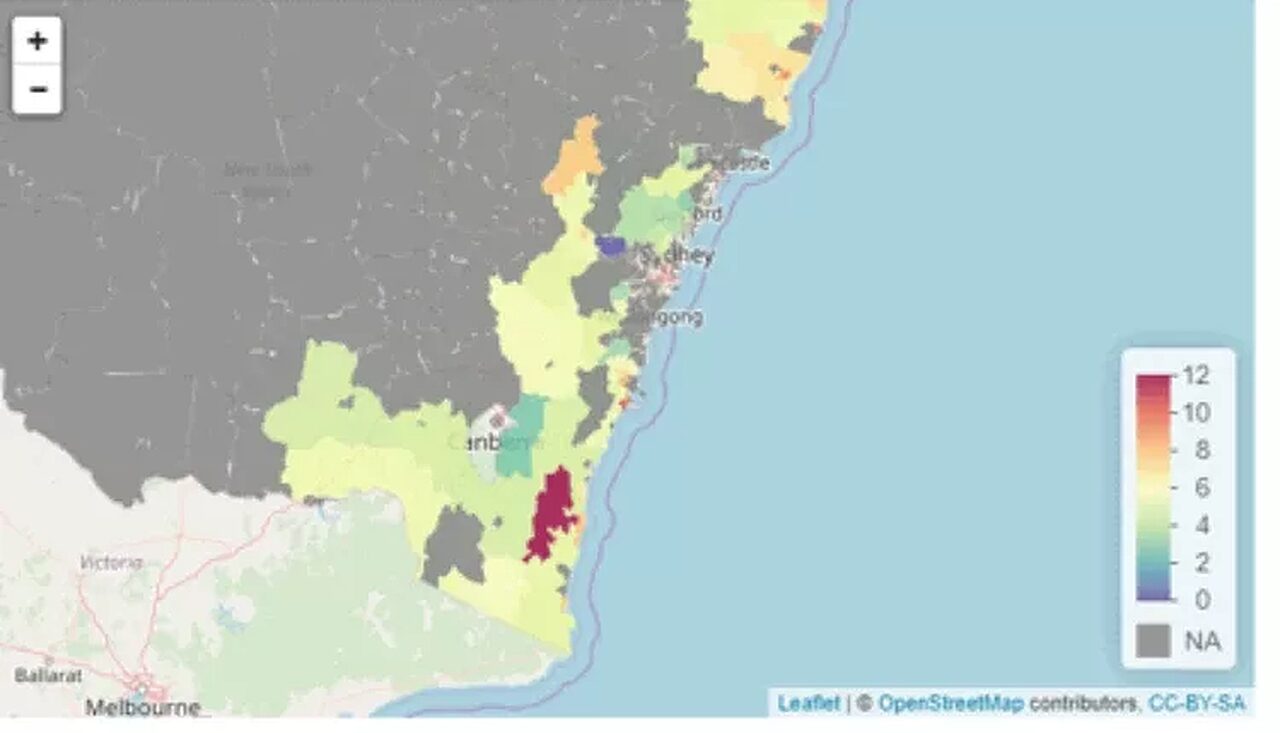
- used R shiny, a digital tool, to create interactive maps to understand the geographic distribution of the demographics Vinnies wanted to reach
- used the maps to identify nearby regions with similar characteristics, such as a high proportion of people with disability (see below).


Tools helped Vinnies reach people when they needed it
The interactive visuals, which Nous created in less than a day, supported Vinnies to explore demographics and make decisions. Vinnies was able to reach people at a time of great vulnerability and offer them support that met their needs.
The data is still being used Vinnies’ work supporting communities as they recover and rebuild.
What you can learn from Vinnies
Combining information from multiple data sets can deliver insights that drive action.
Simple deliverables that do not require training or explanation can be the best solution when supporting decision-makers who are responding to a crisis.
Solutions need to align with the needs of users, otherwise they may be ignored.
